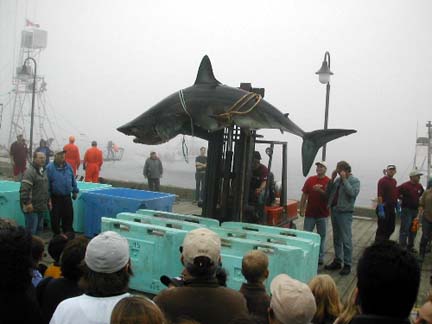
What a sad and undignified ending for an amazing and beautiful creature.
Just keep it the hell away from me.
Be interested to know if there has been a statistically significant reduction since 1970 in the % of SW winds over 20 knots in Perth. Doesn't feel to me like we get almost one day in five or six over 20 knots these days (what the chart shows).
As we all know, the rainfall in the Perth region has certainly dropped off since 1970 - by a statistically significant 25%, or thereabouts I believe.
Hi Downwind,
the wind rose diagram is in km/hr, so i guess it is saying what you're saying too. ![]()
i'd like to see the line graphs like the ones nebs put up calculate on max wind strngth between 9am and 6pm. i think the graphs would change a lot and show the real results for different seasons. 3pm doesn't really give the full pic unfortunately.
Ah yes, Gestalt - missed that km/hr.
Am I reading that right then - the Perth Graph says that there are winds from the SW over 20 km/hr about 18% of the time? About the same as Adelaide (well, I'll be blowed - as an ex Addlebrainian that surprises me)
We get a lot more Westerlies also by the look of it (must try getting out at Woodies in one, one of these days).
But you're right, Nebbian's graphs do show something different. Perhaps at 5 pm would be more telling than 3pm - and show more of the max wind strength?
i think the way it reads is that for perth,
28% of the wind comes from the SW and of that 28% around 60% are 20-30 km/hr or stronger and prob about 10% are stronger than 30 km/hr.
i guess to see what winds over 30km perth receives you need to add up the overall percentages from all directions.
so for SW it's 10% of 28% = 2.8? but i'm not sure about this?
maybe 15% overall at a guess.