I thought I'd start a new thread after reading posts from Shaggy and Lazzz on the VSR thread. Who else is using microcontrollers or RPis for boating applications?
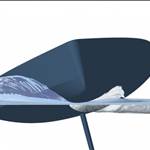
I did some work with PICs onboard a few years back, but now mostly use Arduino Nanos. They're dirt cheap (about $7 from Ebay) and very easy to use. But in one of my recent projects I used a Particle Photon - a bit like a Nano but with a wifi system onboard. You don't even need a USB connection to update firmware - it's all done by wifi. I have the Photon monitoring the NMEA bus, saving all NMEA data (wind, GPS data, depth, etc) locally every minute, and keeping data for the last hour. This in turn communicates with an Android app that I've written, that allows me to chart any of the NMEA variables. There's an example output below (not underway, just 40 minutes tied up).
I find this very useful when cruising. For example:
- when motoring in the calm of the morning, and waiting for a forecast sailing breeze to come in, watching the chart of True Wind can help you determine whether it's "really started".
- When tacking downwind, or heading up above the lay line to get better apparent wind, watching the chart of CLV (closing velocity on waypoint) tells you whether your actions had a useful effect.
- If offshore on the east coast, watching the temperature chart helps you understand whether you're in the EAC.
Having the display on the phone means it's easy while underway and on deck to noodle around the various charts - both me and my wife have it installed.
So - anyone else for show and tell?

Looks interesting but I don't know enough about them. I would like an autopilot based on a Pi or phone connected to a nice big electric motor.
Smart... very smart.... do you happen to know anyway I could get the GPS data from my IPad into NMEA or SeatalkNG??? Or double up the dongle GPS from Opencpn... heard it doesn't like sharing the GPS signal, and would still need to get it to NMEA or SeatalkNG.
I only have a dongle GPS for Opencpn, and IPad for plotters, just want GPS for autopilot for SOG, and maybe more if I add a I70 and the Raymarine GPS must be made of gold for the price they want for it...
Then if you could get AIS from the IPad to NMEA, let's start a business!!
Select to expand quoteCabron said..
Smart... very smart.... do you happen to know anyway I could get the GPS data from my IPad into NMEA or SeatalkNG??? Or double up the dongle GPS from Opencpn... heard it doesn't like sharing the GPS signal, and would still need to get it to NMEA or SeatalkNG.
I only have a dongle GPS for Opencpn, and IPad for plotters, just want GPS for autopilot for SOG, and maybe more if I add a I70 and the Raymarine GPS must be made of gold for the price they want for it...
Then if you could get AIS from the IPad to NMEA, let's start a business!!
Get yourself a Sirf 4 Gps from eBay
Select to expand quoteQLDCruiser said..
I thought I'd start a new thread after reading posts from Shaggy and Lazzz on the VSR thread. Who else is using microcontrollers or RPis for boating applications?
I did some work with PICs onboard a few years back, but now mostly use Arduino Nanos. They're dirt cheap (about $7 from Ebay) and very easy to use. But in one of my recent projects I used a Particle Photon - a bit like a Nano but with a wifi system onboard. You don't even need a USB connection to update firmware - it's all done by wifi. I have the Photon monitoring the NMEA bus, saving all NMEA data (wind, GPS data, depth, etc) locally every minute, and keeping data for the last hour. This in turn communicates with an Android app that I've written, that allows me to chart any of the NMEA variables. There's an example output below (not underway, just 40 minutes tied up).
I find this very useful when cruising. For example:
- when motoring in the calm of the morning, and waiting for a forecast sailing breeze to come in, watching the chart of True Wind can help you determine whether it's "really started".
- When tacking downwind, or heading up above the lay line to get better apparent wind, watching the chart of CLV (closing velocity on waypoint) tells you whether your actions had a useful effect.
- If offshore on the east coast, watching the temperature chart helps you understand whether you're in the EAC.
Having the display on the phone means it's easy while underway and on deck to noodle around the various charts - both me and my wife have it installed.
So - anyone else for show and tell?
HI Qldcruiser,
That's very cool, thanks! That what I am trying to get to, but you're much more advanced than I am!
Question for you, was the graphing part hard to do?
I am still working on the input stuff, so I haven't got to the output to a display yet. Was it hard to create the multiple graphs to display the data?
I am trying to treat this exercise a bit like a data analysis program, so the basic concept is I want a line graph display where I can select the data sources I want to have compared in the graph. If you want to display multiple data sets on the same graph, you just select t by clicking on the buttons above the graph. I've attached an example of what I am trying to achieve.
If I can scrape the BOM data in real time and record this as another input, its no different to the on-boat stuff, it's just another dataset you are logging and can compare at your leisure.

After a race, I can use Time as the Y value (the time is sourced from the GPS) and then I can put up all of the data inputs I want to compare over the duration of say a 2 hour race. Once they're all displayed, I can then look for aberrations, ie: peaks and troughs.
I've had a GoPro on the rear rail that is time synched for a still image every 60 secs in time lapse mode. This is so I can go back and see our trim at the time to see if we can improve anywhere.
If I get really good, I should be able to log and display those still images as I click on the graph.
Some days it feels like it's all too hard, but I'm making progress, just at what feels like a snails pace!
Congrats on what you'be built mate, I'm jealous!
Edit: I'm missing a few inputs from this list, I'd also record the following as inputs; Heading, Bearing, Leeway, Current direction, Current strength, % of polars, and Sailect data (what sail choice and reefs is recommended from the sail loft).
Hi Shaggy, no the charting was fairly straightforward. There are lots of free charting packages available for Android - I picked mpAndroidChart, because I could see a way of doing the arrows for wind direction, overlaid on the wind speed chart, a la Seabreeze. For me, both the Android environment and programming in Java were the biggest learning curves - most of my programming experience is in Delphi for Windows. I did a few weeks of an online course in Java, and now I quite like it as a programming language. Android took a bit more time to begin to come to grips with, and I still don't really know what I'm doing! In my app, each chart is an object with its own picker for the charted data, so any number of them could be on the screen. PM me if you'd like some code - although it won't be any use unless you're using Android.
I think the calibration of the various instruments is likely the biggest problem for your application, where accuracy is critical - I have Raymarine ST60 instruments, and I've never been confident of my ability to calibrate them very accurately. And, as you posted on the other thread, if your inputs aren't accurate, the calculated True Wind values could be way off. For my application, I'm using GPS data for SOG, which is more accurate than STW (which is used by the Raymarine displays for True Wind). However this means that the calculated True wind is referenced to earth, rather than the water. That's what I want, but for racing it may not be. Usually, of course, there's no significant difference, but in very light conditions with a 2-3kt current it could be substantial.
Another critical issue is how to average the data - I save a value every minute for plotting, but since the NMEA system reports a value every couple of seconds, what's the best way of making the saved data representative of that minute? I've chosen to take a mode of the most recent 11 values. The mode is less influenced by short-term extreme values than a mean. You could also use a trimmed mean (discard the one or two most extreme values). I'm mostly interested in what the weather's doing, so I probably should be averaging a greater number of data points, however I'm doing these calculations on the Photon chip, so I'm always very conscious of the limited amount of memory available. In your case, I'd say the averaging period should be related to the responsiveness of the boat to changed conditions, eg if you head up by 10 degrees, you should not rely on speed until it's had a chance to settle to the new conditions.
Looking at your list of variables, I see you don't have anything about sea state, which makes a big difference to our boat. Maybe you have enough sail and trim choice to always be properly powered up, but I find in 10-12kt of breeze, we can probably do a full knot more in flat water inside Moreton Bay compared with the chop outside. Not a quantitative variable, but it might help interpret results, a bit like your Sailect data.